Charts
In addition to the integrated charts that comes with Grid application, Our Business Applications has also an exclusive application for dynamic JavaScript graphs creation and customization, with a drag and drop interface for organizing metrics and dimensions in a easy and fast way. With Our Business Applications charts, you never have to start from scratch. See here some features for building Charts.
Support for various chart types
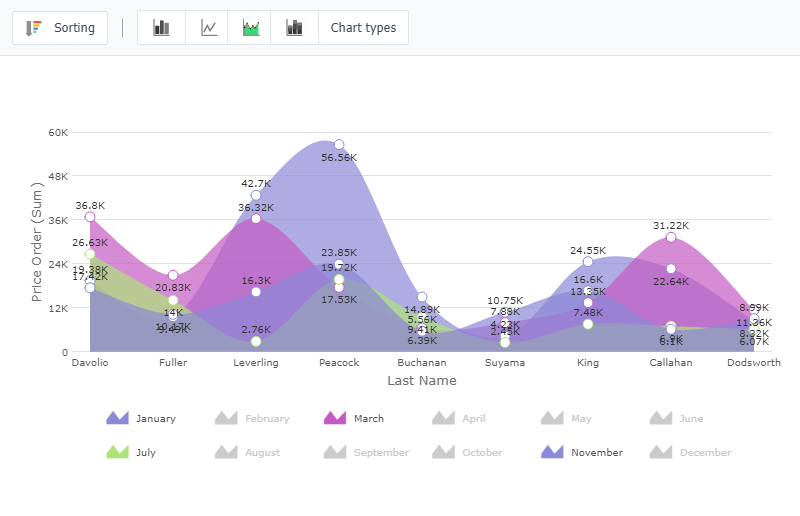
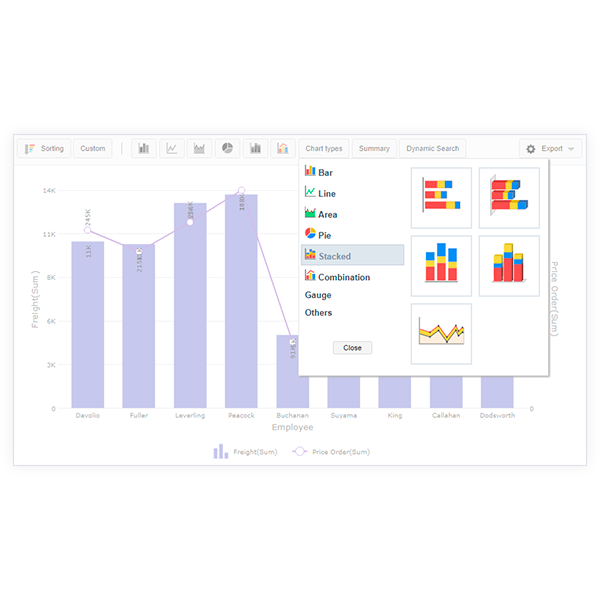
From the basic charts (line, column, pie etc. - 2D & 3D) to the most complex ones (gantt, bubble, gauge, zoomline etc.), we have an exhaustive collection of javascript charts that you can apply to your projects.
Samples
Area chart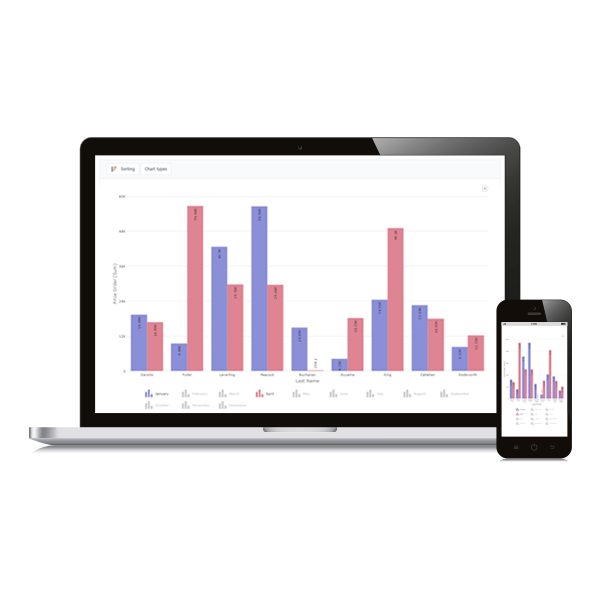
Responsive Charts
When you create a chart with Scriptcase, you should not worry about the browsers and devices it will work on. That's why we have made sure that our charts work seamlessly across PCs, Macs, iPhones, iPads, and Android devices. All the charts are responsive in order to deliver the same experience everywhere.
Our Business Applications uses the FusionCharts library Internally for its charts creation. It’s already integrated within the source code with no additional cost to you. FusionCharts has over 23,000 customers and 500,000 users in 120 countries, including technology giants such as Apple, Google, ZOHO, Cisco, Facebook, Intel, LinkedIn, Microsoft, Hewlett-Packard, IBM, EMC, Nokia, Tibco, as well as The Weather Channel, NASA, and the Federal Government of the United States.
Samples
Chart of Bars 2DChart of Bars 3D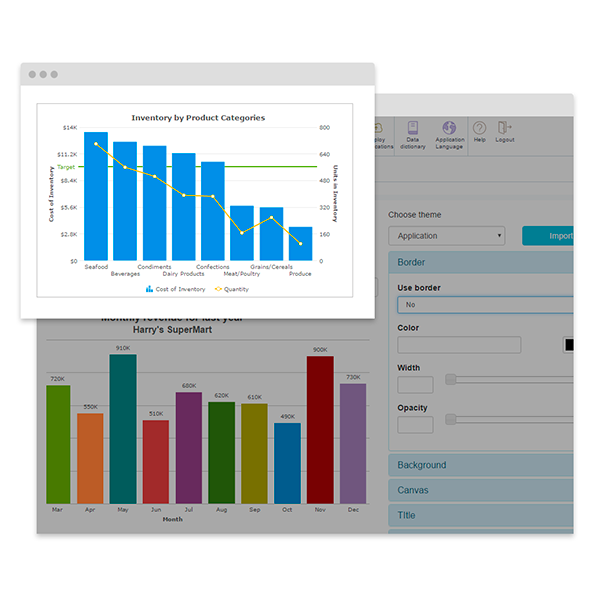
Chart Themes Editor
Graphical interface for themes customization, at a project level or individually within the application. Through the theme editor it is possible to customize the layout of Our Business Applications generated graphics as background color, border, size, opacity, etc.
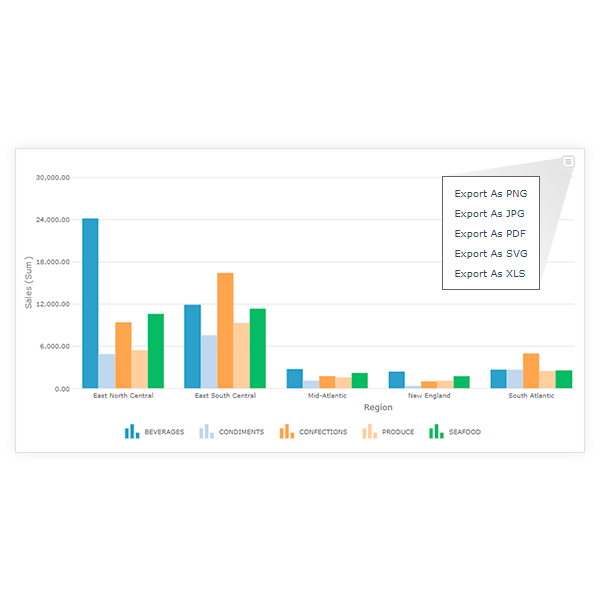
One Click Export to PNG, JPG, PDF, SVG e XLS
Within Our Business Applications charts it is very easy to download/export all your JavaScript charts to the format of your choice - JPEG, PNG, PDF or SVG. All you need is to include a single line of code. Both client-side and server-side exporting are supported.
Samples
Area chart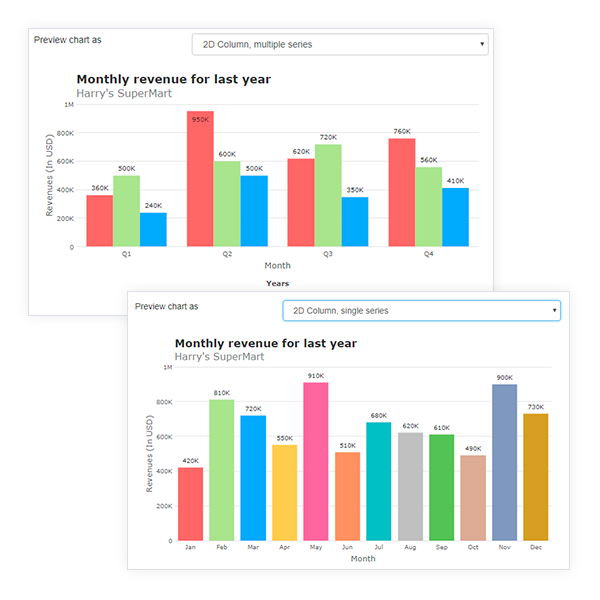
Multi-series or Drill down graphics
It’s possible to combine analytical (multi-séries) and synthetic (Drill down) of different sizes on the same graph, and this can be changed at runtime by the end user of the system.
Samples
Area chart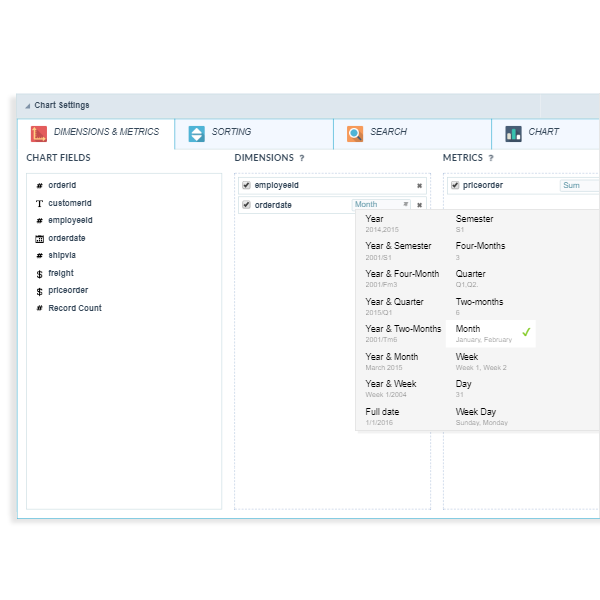
Different date periods Combination
For date fields, the Chart applications offers different viewing options of periods in dimension, such as: Semester, Quarter, Trimester, Semester and others, that can be combined on the same chart for dynamic selection by the end user of the application.
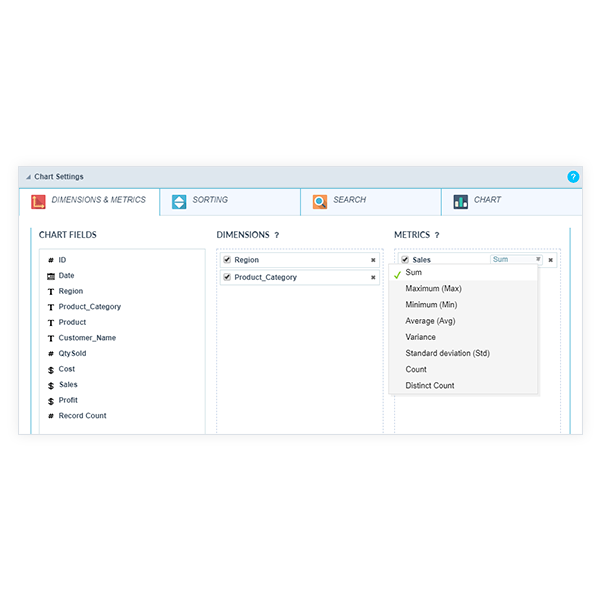
Aggregate functions
You can dynamically set different aggregate functions to graph metrics, including: Sum, maximum, minimum, average, Weighted Average, Count, Distinct count, variance and standard deviation.
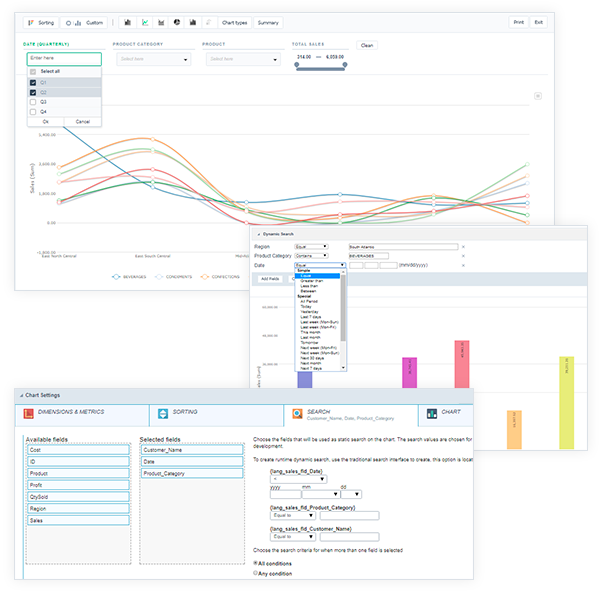
Chart Filters
Our Business Applications Charts offers different filter types to the user of the system so it’s possible to dynamically select the data within the chart at run time:
- Advanced Search -Filter module which works integrated with the Chart to check for data view before the Chart display. It offers a range of search criteria and conditions according to the given type (equal, start with, does not contain, other than, greater than, less than, between values, empty, Null, different date periods, etc).
- Dynamic Search - Filter for dynamic selection of conditions and fields directly within the generated application. With this filter the end user may choose fields and conditions at runtime.
- User Search - Dynamic filter for charts data. It filters the data dynamically within the generated graphs at runtime using ajax.
LIMIT Function
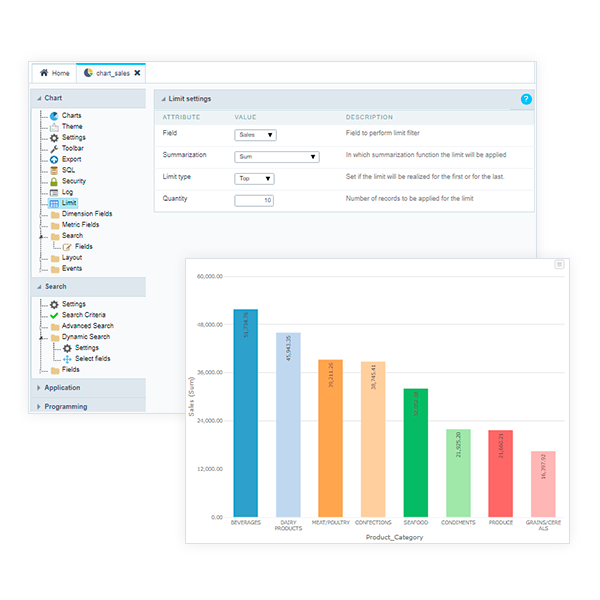
Easily apply a LIMIT function for the chart SQL that can be used to rank the values within the graphics. Create for example: graph with the 10 best customers, 10 cities that have sold less in 2016, etc.
Geographical Maps
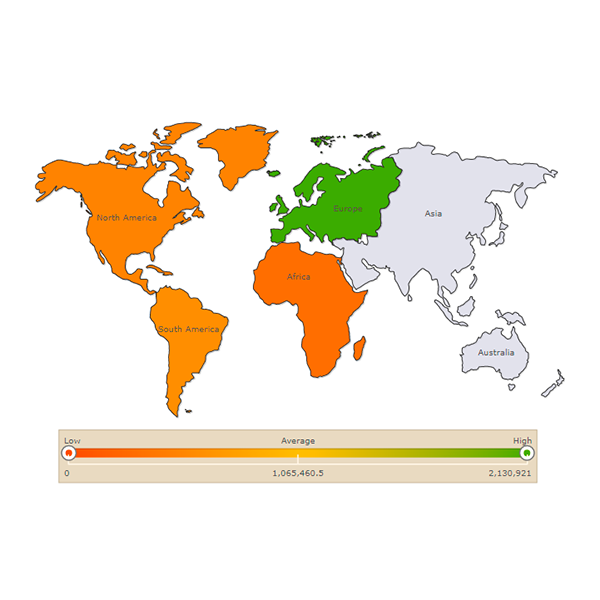
Native integration with FusionMaps XT JavaScript charting library that has over 1400+ geographical maps, including all countries, US states, and regions in Europe for plotting business data like revenue by regions, employment levels by state and office locations. FusionMaps XT does not work on zip codes or latitude/longitude, it uses an internal coordinate system to plot points.
